Most real estate investors watch for obvious distress signals — Notice of Default filings, tax liens, code violations. These are solid indicators. They’re also lagging: by the time a formal filing exists, the distress has been building for months.
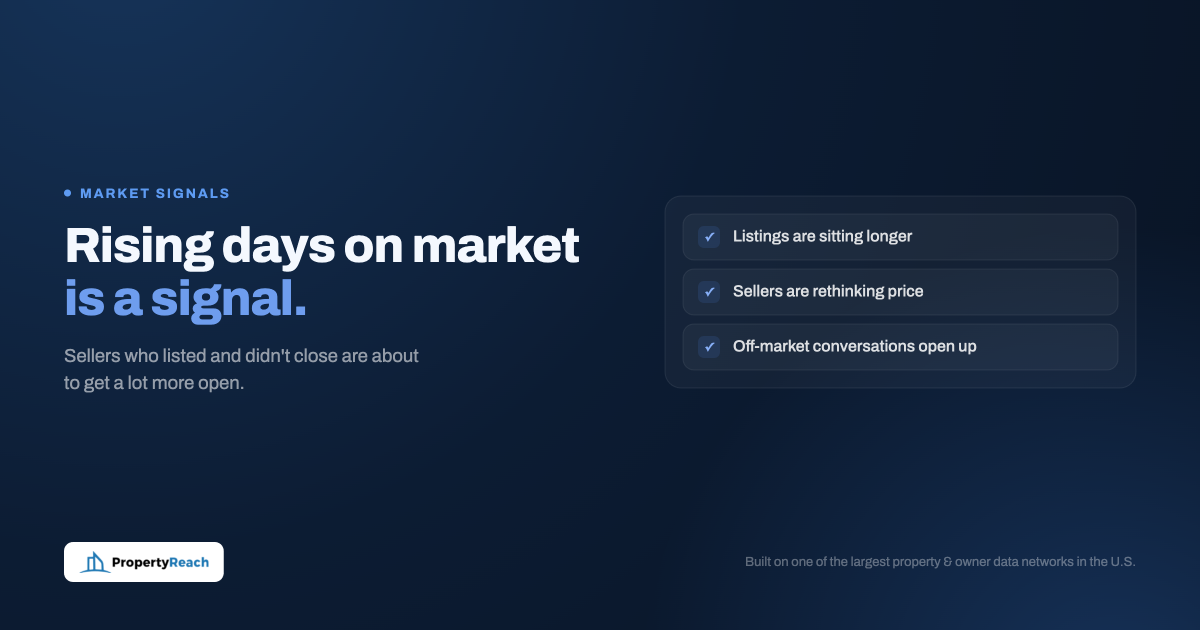
Rising days-on-market (DOM) in a target area is a leading indicator — one that often shows up 60 to 90 days before the motivated sellers it creates start appearing in distress databases.
What Days on Market Signals
DOM tracks how long MLS-listed properties in a given market sit before going under contract. When DOM increases, it means sellers are pricing ahead of where buyers are willing to go — or buyer demand is softening faster than sellers are adjusting.
For buyers and agents, rising DOM is straightforward: more negotiating leverage, more time to be selective.
For off-market investors, it signals something different: sellers who listed and didn’t close are about to start exploring alternatives.
When DOM Rises: The Off-Market Opportunity
A typical path for a seller in a rising-DOM market:
- Lists with an agent at an optimistic price
- Sits on market 30, 60, 90 days with no acceptable offer
- Reduces price, still doesn’t close
- Withdraws the listing — either because the agent contract expires or because they decide to regroup
- Becomes more open to an off-market conversation than they were six months ago
Sellers who have been through this process have already answered the “do I want to sell?” question. The answer was yes. The problem was price and process. An investor who reaches out with a realistic offer and a clear, simple process is offering exactly what they couldn’t get through the MLS.
The Behavioral Shift That Happens Before Formal Distress
DOM trends also predict what comes next in the distress cycle.
When DOM rises and a market softens, property values stabilize or decline. Owners who bought at the peak or refinanced at high valuations find themselves with less equity cushion. For some, that means a manageable adjustment. For others — particularly those with other financial pressure — it’s the beginning of a path toward pre-foreclosure.
This is the window most investors miss. They’re monitoring NOD filings, not DOM trends. The investors building pipelines right now in soft-DOM markets are positioning for deals that will be available in the database three months from now.
Combining DOM Trends With Property-Level Data
DOM is a market-level signal. It doesn’t tell you which specific properties to target. You need to combine it with property-level data:
- Filter for prior MLS listings that expired or were withdrawn in the last 6–12 months
- Cross-reference with equity position — rising DOM often reduces equity estimates as AVMs update
- Add absentee ownership flag — out-of-state owners feel the carrying cost impact of a slow market faster
- Check for any new distress signals that have appeared since the listing expired
The combination of “listed-and-failed” plus rising DOM plus any equity or ownership flag creates a strong motivation profile without waiting for an official NOD filing.
How to Act on Rising DOM Data
Once you’ve identified a rising-DOM market, the outreach approach adjusts slightly from pure distress outreach:
- Lead with market awareness — “I’ve been watching this market and saw your property was listed a while back” signals that you’ve done work and know the context
- Don’t assume distress — The seller may be doing fine financially; they just couldn’t close on-market at their target price. Approach with curiosity, not assumptions about their situation
- Reference the process advantage — No agents, no extended showings, no repeat price reductions. A clean off-market close often appeals to sellers who are frustrated with the traditional process
Frequently Asked Questions
Where do I find current DOM data for my target markets?
DOM data is available through MLS feeds, Zillow and Redfin market trend pages, and real estate data platforms that aggregate market-level statistics. Track it monthly for your core target markets to spot trends early.
How much does DOM need to rise to indicate opportunity?
There’s no universal threshold — what matters is the direction and rate of change relative to the market’s recent history. A market that goes from 18 days DOM to 35 days DOM in two months is a meaningful shift. A market that goes from 45 to 48 days is normal variance.
Does rising DOM indicate a buyer’s market everywhere?
Not necessarily. DOM can rise in specific zip codes or property types within an otherwise healthy market. Hyperlocal DOM data — at the zip code or neighborhood level — is more actionable than county-level averages.
Build Your List Before the Market Moves
PropertyReach gives you property-level filters to act on market signals before they show up as formal distress filings. Build your pipeline earlier than the competition.
Get Started Free